Journalism Portfolio
Electric Infrastructure Reporting Projects
The work that I find most exciting is often highly technical and requires piecing together multiple variables.
About a decade ago, I started studying Claremore’s electric grid because residents kept reporting excessive bill spikes. The problem wasn’t constant, so it was easy to dismiss with expected answers about summer demand, but even that couldn’t explain why ordinary residential customers could suddenly consume at times two or three times more kilowatt hours than the Oklahoma average, 1,079 kWh.
I worked to understand all the theories on why Claremore seemed different than nearby communities. During that work, I met with a lineman and learned about a pole built in the 1960s, but I struggled to understand how line loss from old poles or lack of conduits could increase residential bills.
I requested billing data to conduct a geospatial analysis of pricing trends and identify clusters of unusual energy spikes. The city denied the request, citing operational disruptions. In hindsight, I would have asked the public to submit their data and then narrowed my request based on preliminary findings.
However, a new study the city commissioned last fall found four area with critically low voltage (101.8V). Now I’m completing a project on how low-voltage impacts current and appliances, and possibly accounts for those unpredictable bill spikes.
Data Storytelling
City Council Coverage
Public Response
Education Reporting Projects
Sometimes, data stories are best told by focusing on the smallest unit of a larger number.
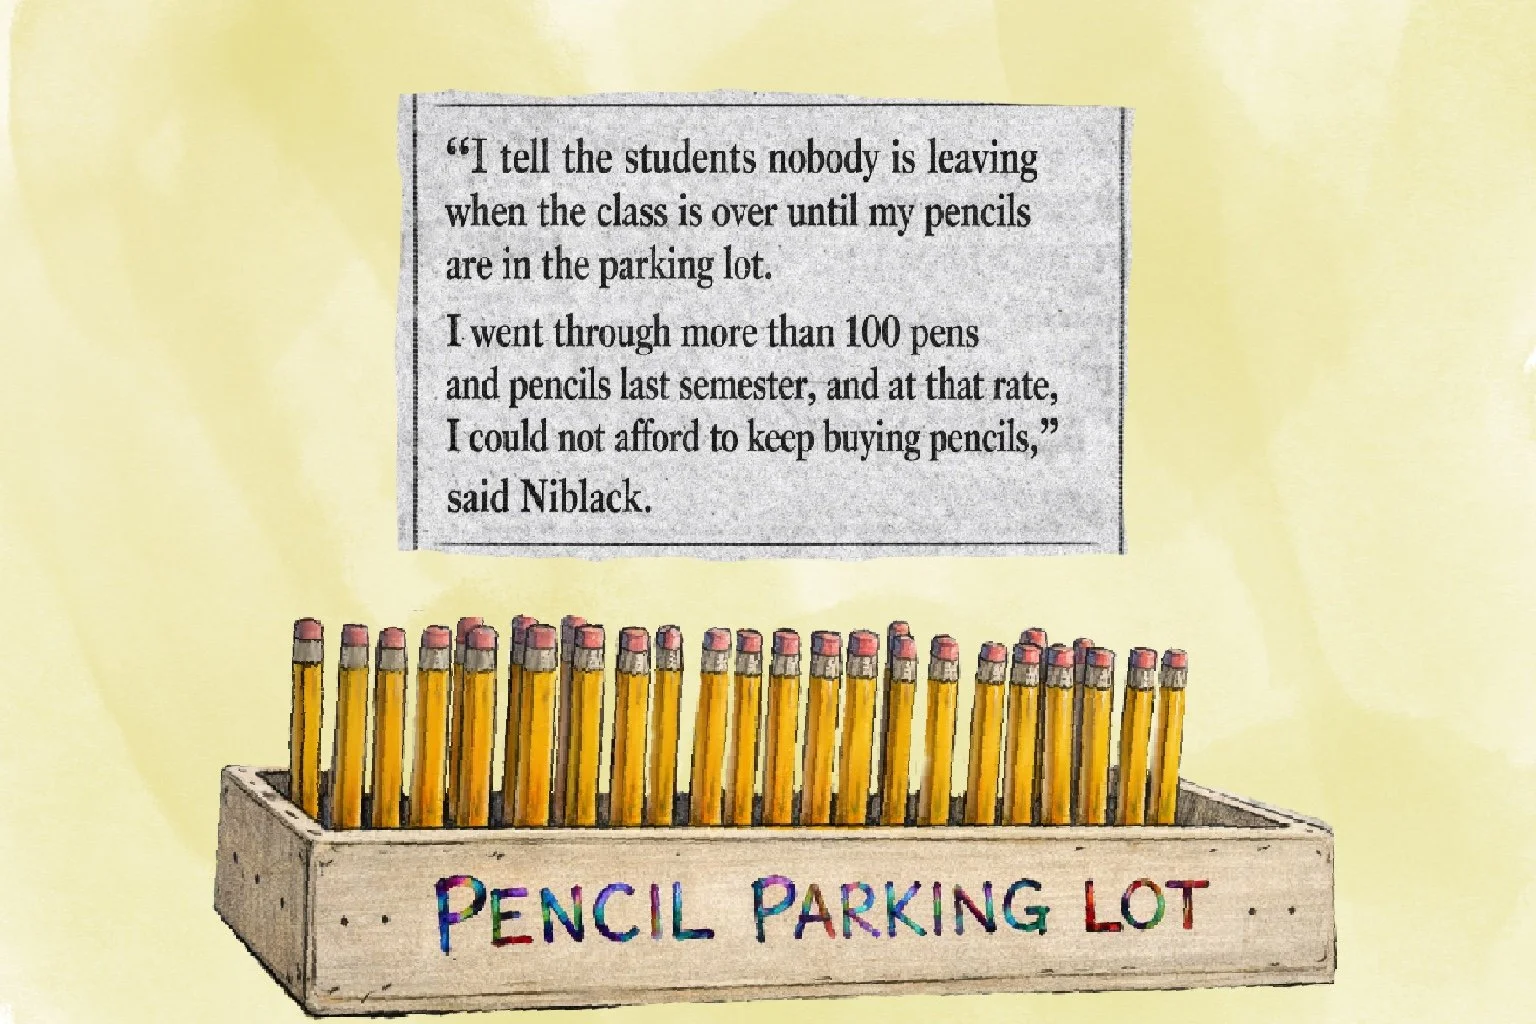
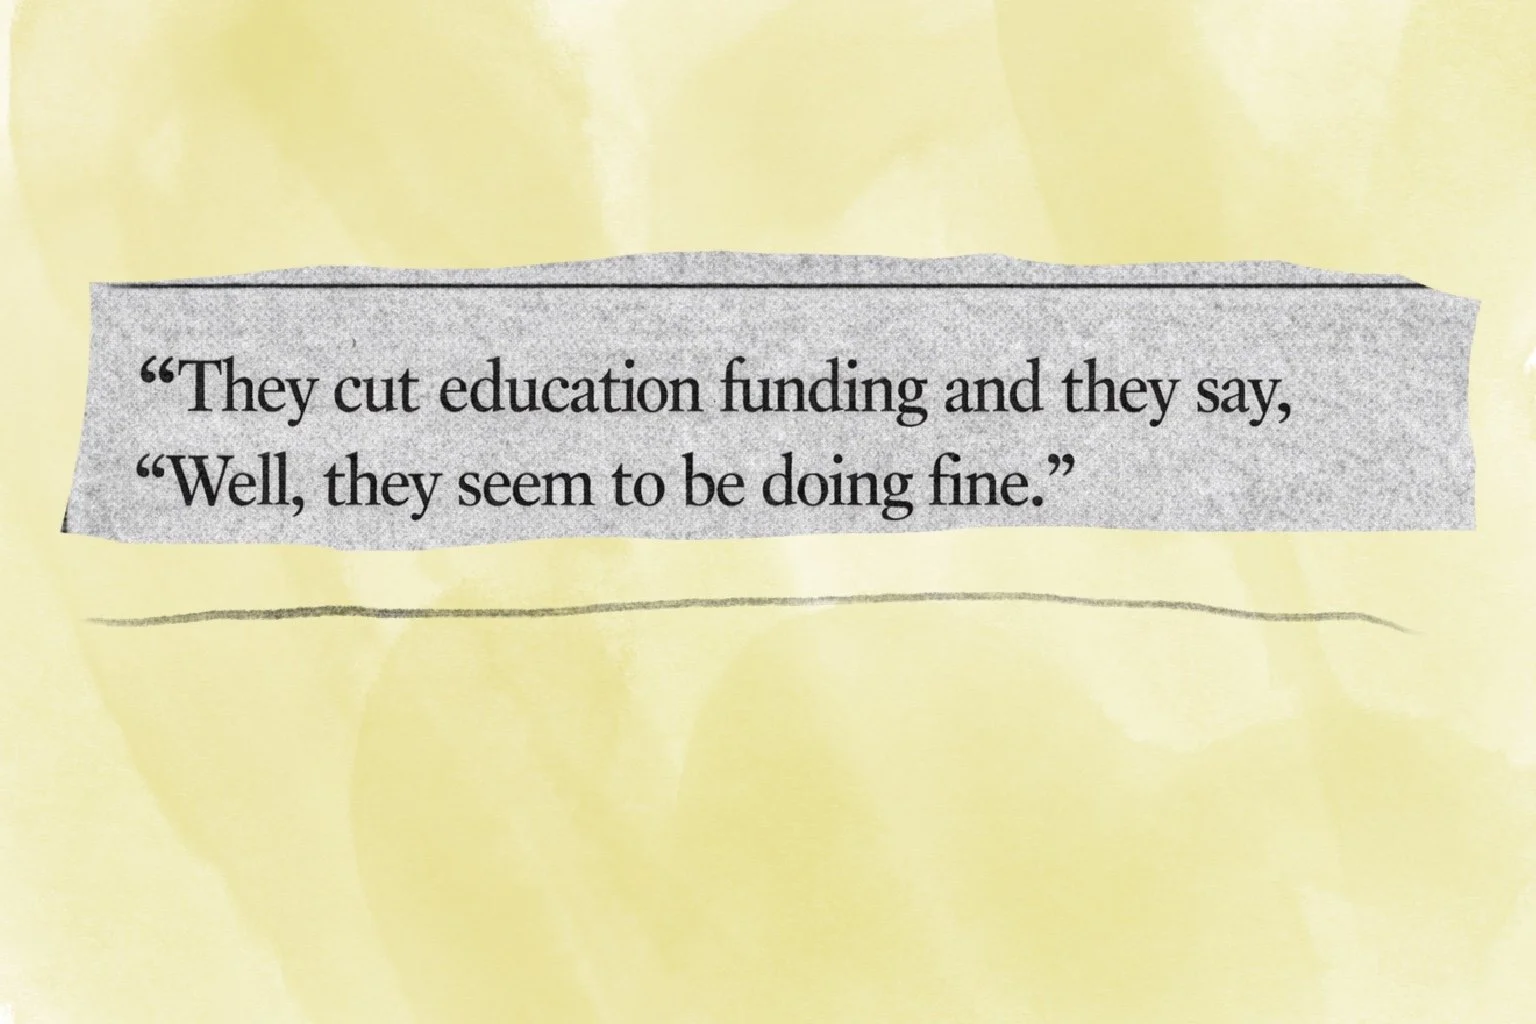
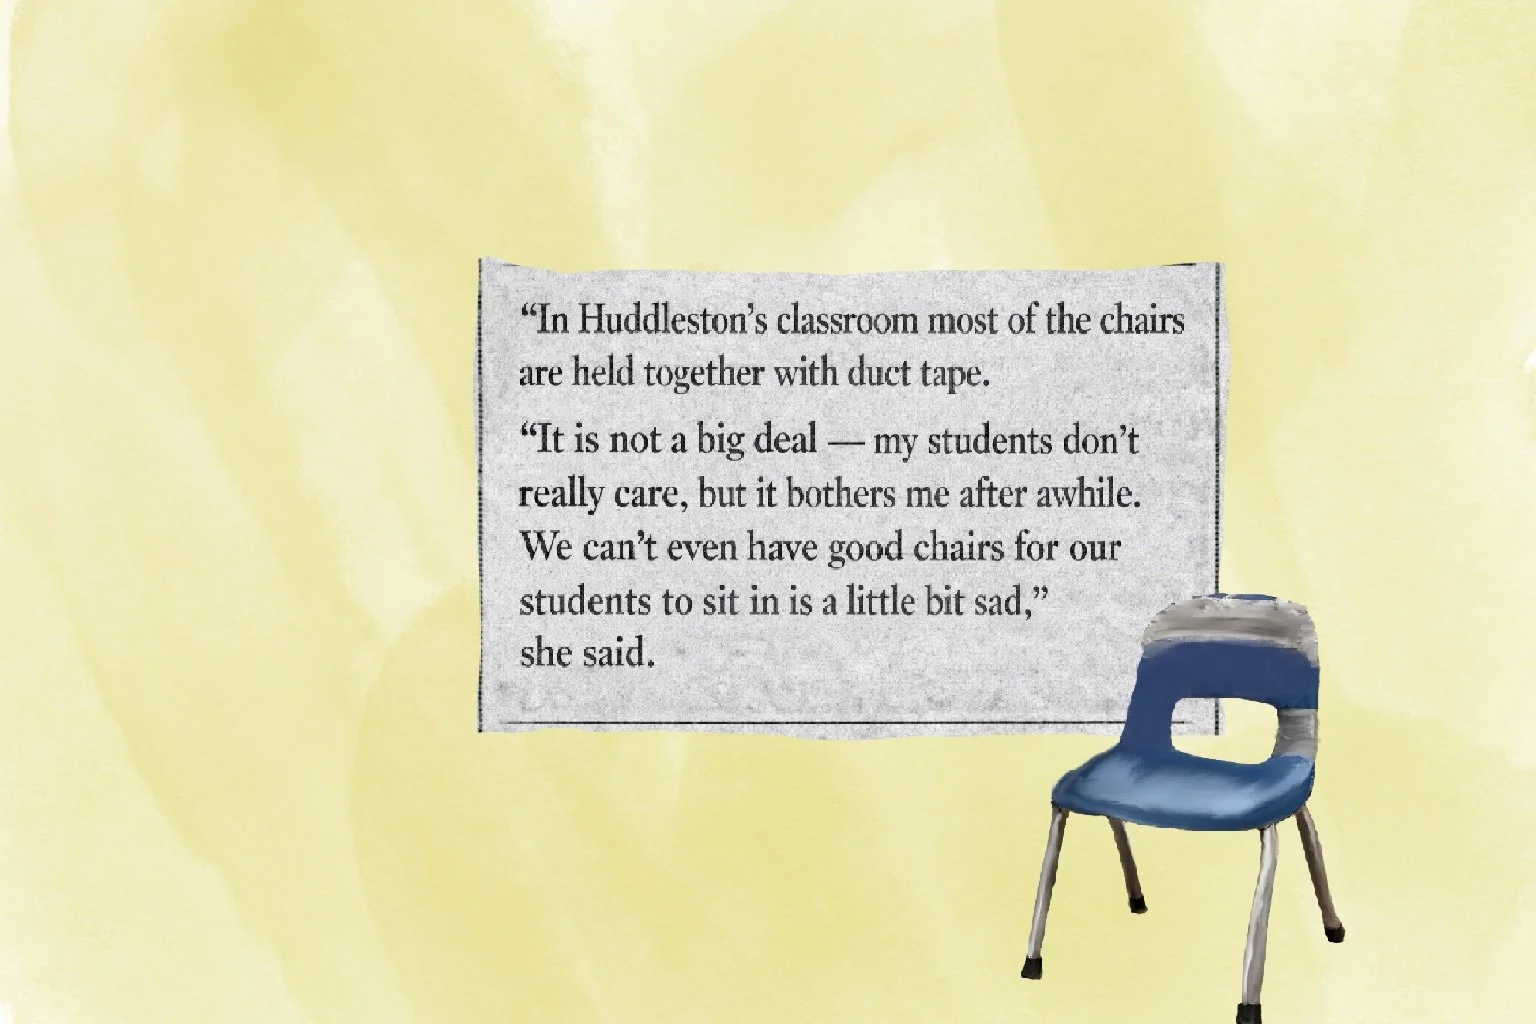
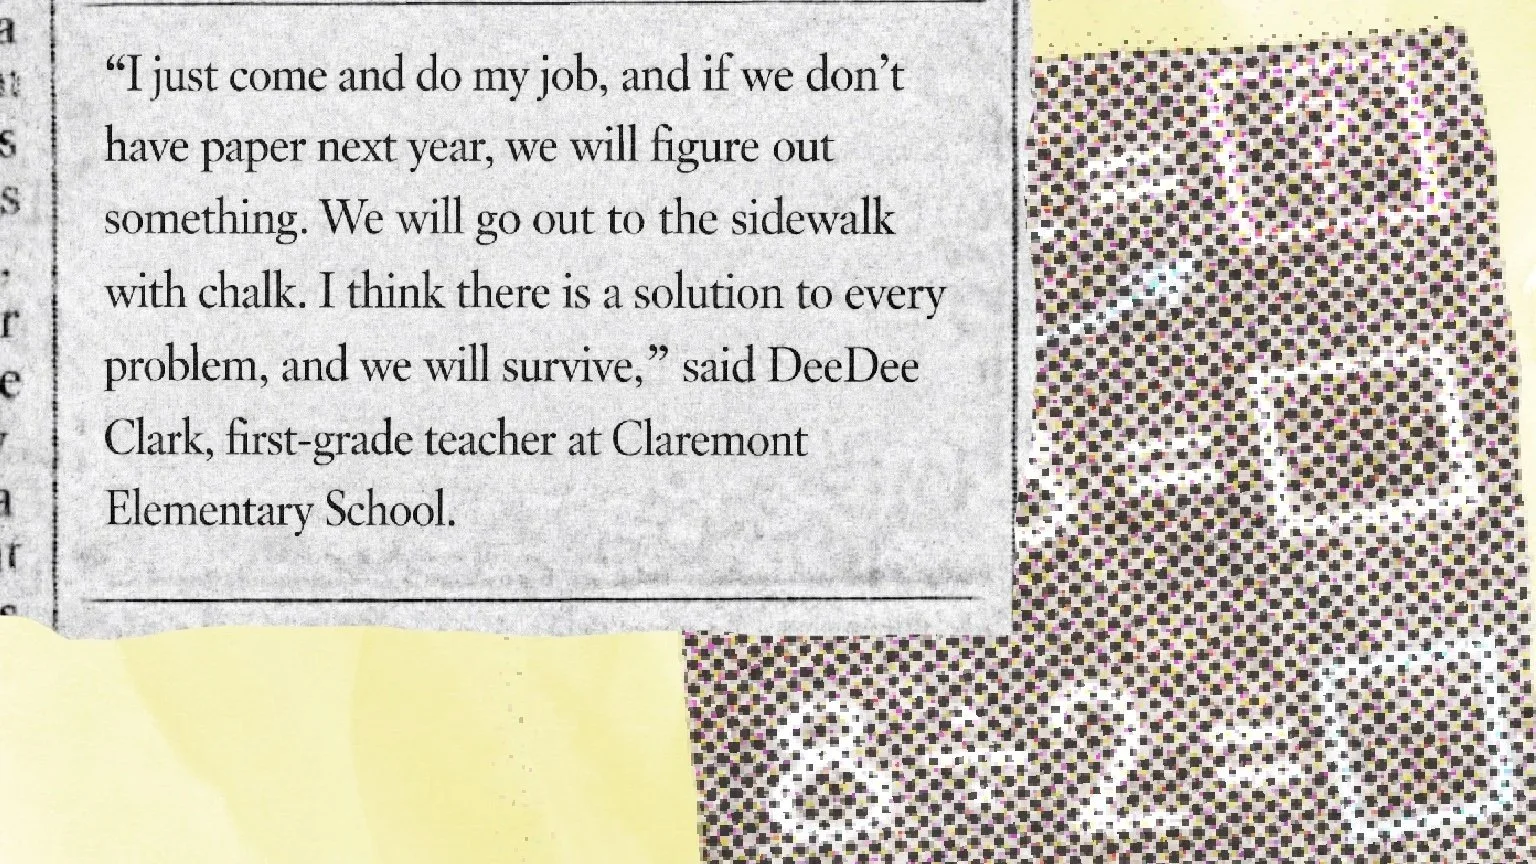
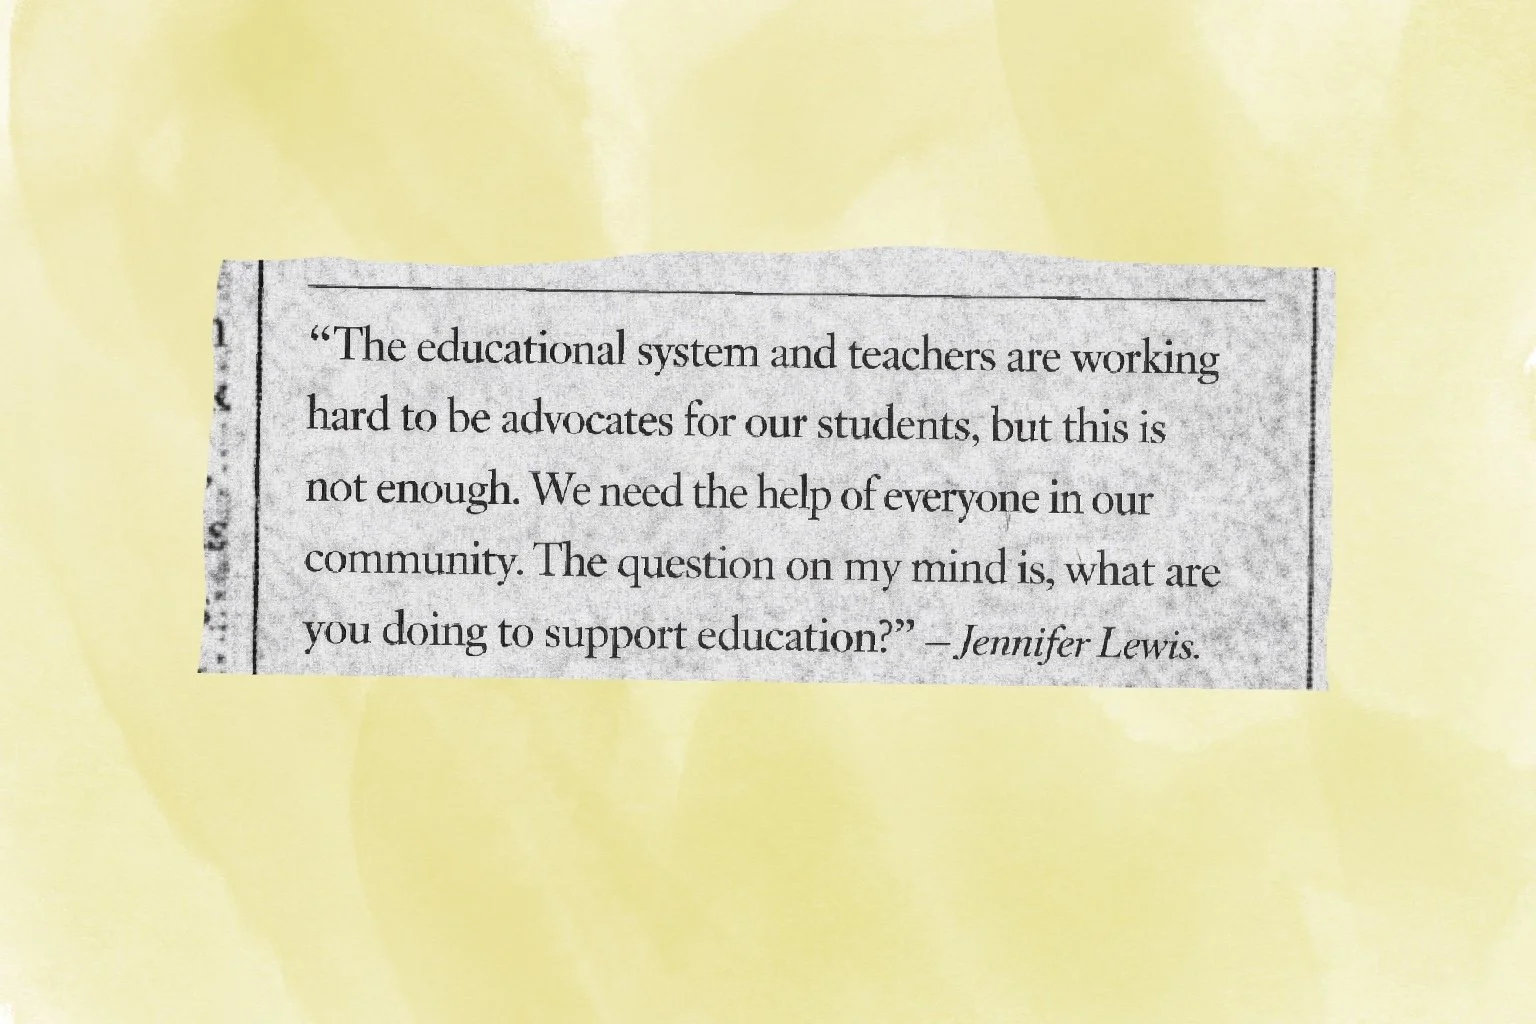
When Oklahoma was making cuts to education, I decided to write stories that made intangible percentages or district-wide financial impacts more accessible by focusing on classrooms where teachers had worked for 10 years or longer, and I wanted to understand where they already felt the financial strain.
If I were to improve this project today, I’d create an interactive dashboard, like a sliding scale. Readers could slide budget cuts up and down and see what impact that would have on the typical classroom. For example, classroom size, supplies and money contributed by teachers and families. I’d also expand the impact on families and how the back-to-school lists have changed because of the cuts.
School Board Meetings
Academic Research
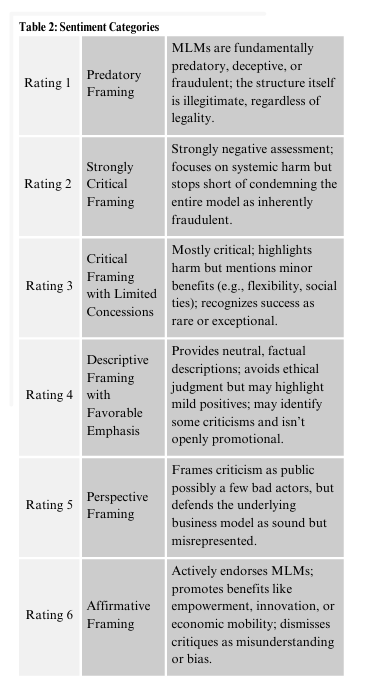
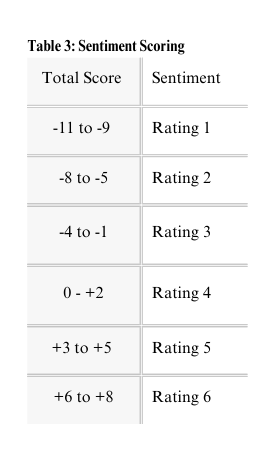
One of my unique strengths is organizing and analyzing unstructured or semi-structured qualitative data. In an academic research project, rather than a conventional literature review, I built a topic taxonomy and a six-point sentiment scale to examine how sampling choices (especially snowball sampling) can influence tone in academic studies.
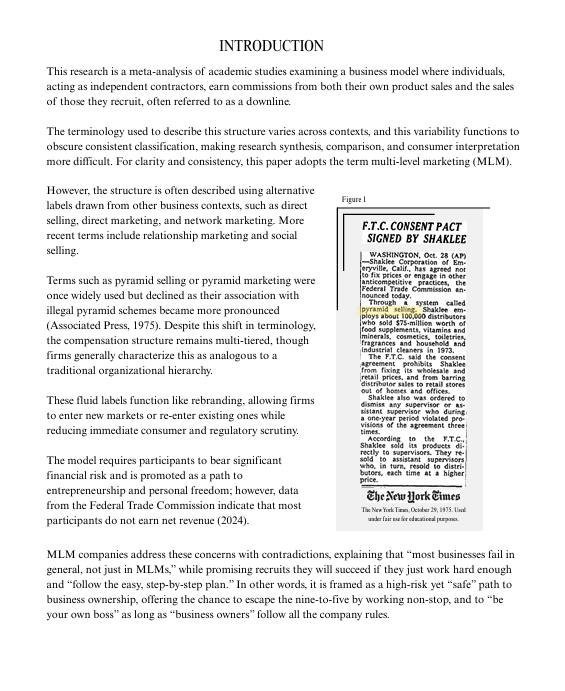
Sentiment analysis involves at least some subjective judgment, so I prioritized transparency and replicability. I designed a structured rubric that paired guiding questions with point values so it’s possible to audit edge cases or extend the dataset without rebuilding the coding framework.
Artificial intelligence (AI) was used selectively to support early-stage content review, data cleaning and preliminary categorization. However, at the time, the model consistently underperformed at identifying complex sentiment. It’s possible the problem is that academic papers use neutral scholarly language even while implicitly endorsing or critiquing multi-level marketing (MLM) structures, so final sentiment decisions were made through manual review guided by the rubric.
One revision I would make in a future iteration is to merge the topic category “exploitation” with “regulation.” When sentiment was analyzed by category, it’s hard to define a situation where “exploitation” could skew toward positive sentiment, which limited its usefulness as a standalone category. In practice, exploitation themes frequently overlapped with regulatory discussions, and integrating exploitation into “regulation.”
Additional Writing Projects
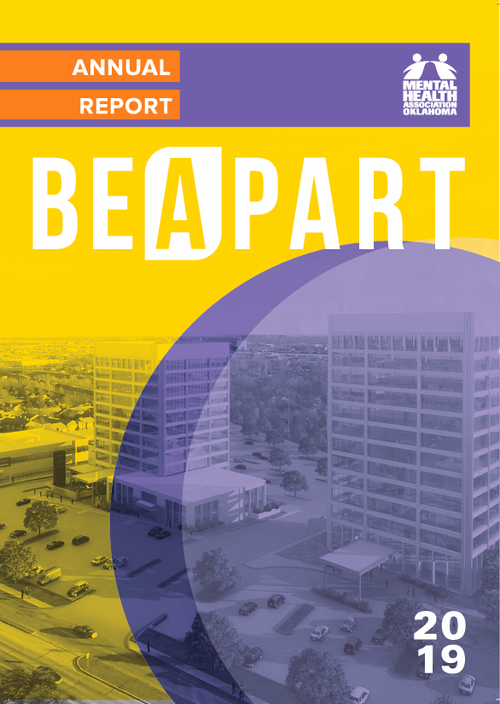
Annual Reports
Data Visualization
Qualitative Data